Let Us Introduce You
Meet Jackie, AKA The Creative. Jackie’s love of running with a new idea results in beautifully impactful insights and (bonus!) show-stopping Halloween costumes.
Share
By Kelly Pellico
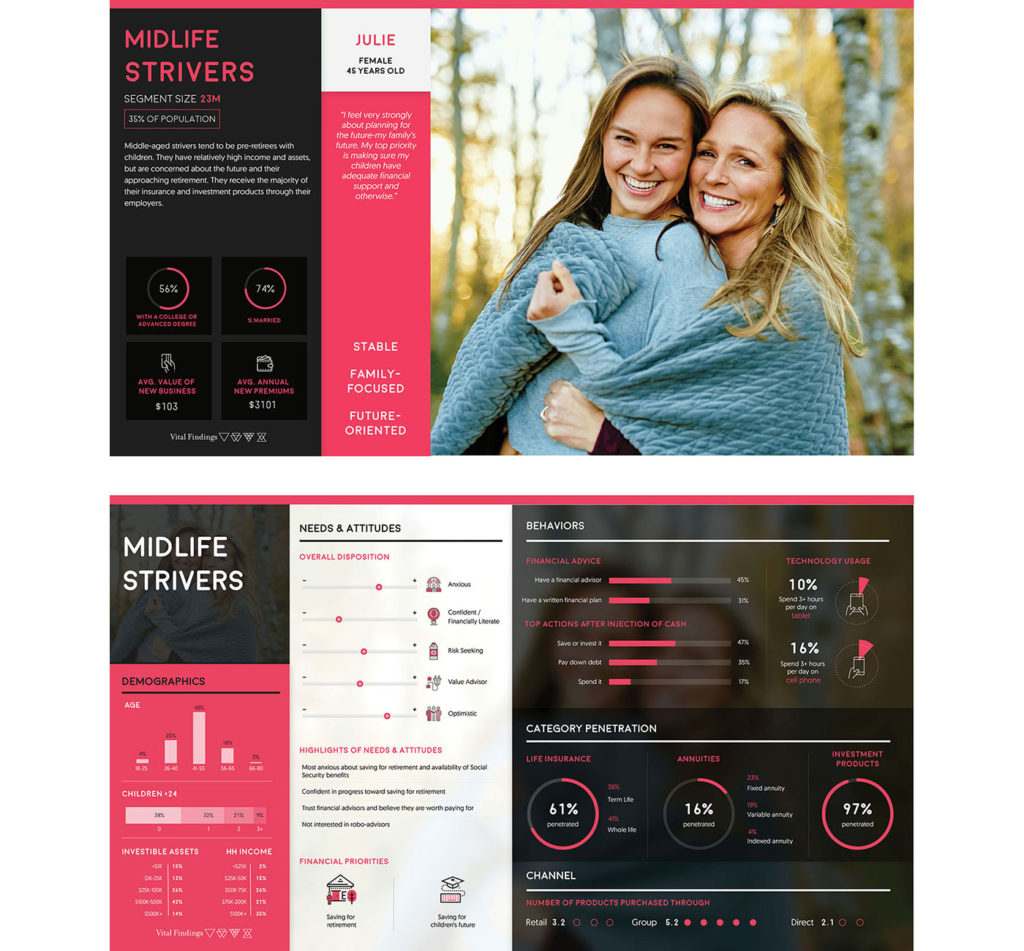
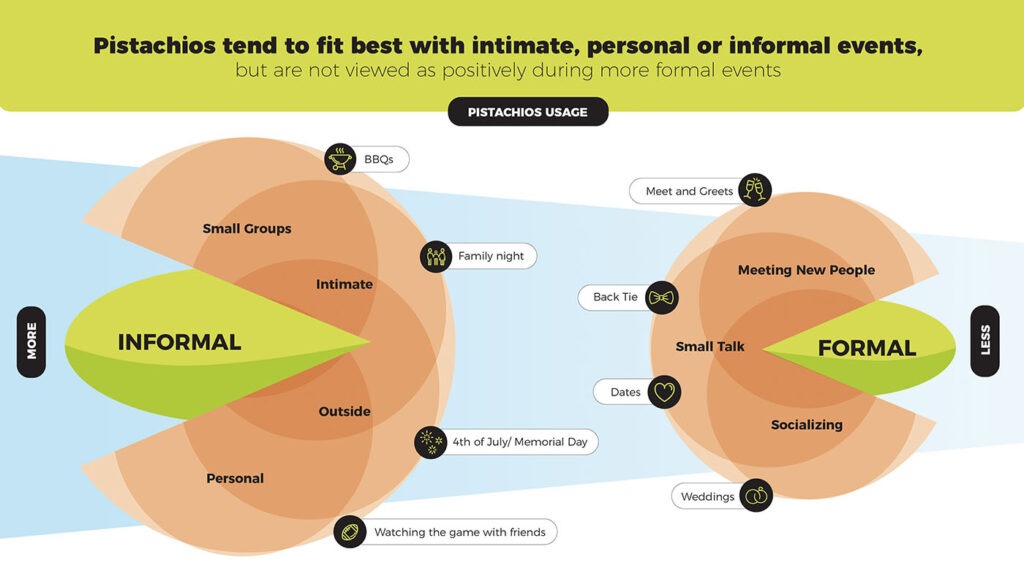
One of the things Vital Findings is best known for is our design. Data is complex. Stakeholders are time-strapped. The importance of visualizing each and every insight in simple and highly engaging ways can’t be understated. As one client recently remarked, “The beautiful reports help with socialization and attention spans, which is critical to what we do.”
So, in the third installment of our “Let Us Introduce You” series, I’d like you to meet Jackie, the creative brain behind our visually impactful and gorgeously laid out designs. Jackie has a deep love and talent for all creative pursuits. Read on to learn how she thinks about data visualization, and what inspired her to pursue a career in design.
(And catch up on the first two editions of the “Let Us Introduce You” series here: Brian and Steph).
Tell us a little bit about your background.
I went to school for Visual Communications Design at Ohio State. After graduating, I worked for three years in their Dining & Housing Department where I got to try my hand at a lot of different design spaces, from menus and posters to apparel. When I moved to Los Angeles, I freelanced and found that I loved data visualization. I had taken an infographics class in school, and it had been my favorite class, so there was a lightbulb moment for me. I looked into market research agencies and discovered Vital Findings.
What originally sparked your interest in design?
I had an art class in high school. My art teacher said I was pretty good and should look into it as a career. I wasn’t sure what kind of art, so I researched different art degree programs and found design. I looked into architecture as well, but all those students seemed really stressed out, so I avoided that route! Design felt right because it’s art but it’s balanced with an analytical side as well which really spoke to me.
You lead Vital Findings’ Design Studio. What do you love most about your role and about working for the company generally?
When it comes to data visualization, Vital Findings has been a trailblazer within the industry. The creativity and craft of telling an insights story is woven into the fabric of the company, and perfectly hits my sweet spot. I love the creative freedom here. The research team develops the story and leans on the design team to help bring it to life. The culture is very supportive of trying new ideas so I can really own the design vision and carry that through. There’s also a variety in what we do that keeps me excited. And, of course, the people are amazing to work with.
You’re heavily involved in planning Vital Findings’ social events, and have had some epic moments – specifically Halloween costumes, karaoke songs, and even a music video…
[Laughs] I don’t know how to explain that. I love a theme and other people at Vital Findings love a theme, so I just get carried away with it. And I like to try new things. If an idea pops in my head, I’ll run with it.

What style or approach do you most often use to tell an insights story in a visually engaging way?
For me, it’s about breaking the information down into smaller parts, especially if there’s a lot of text on a page as you’ll see in qualitative reports. When you see a wall of text, you don’t want to go through it. But if the text is broken down into specific components with hierarchy, then you’ll engage. My job is to create a path that’s easy to follow so that a lot of information can be delivered in an easily digestible way. It’s first finding ways to highlight the main message on a page so that what’s most important is known, and from there creating the path that leads the reader to the supporting points.
I also, stylistically, lean most heavily on a minimalist design approach. There are different visualizations or media formats that can and should tap into other design trends. Ads, for example, can be effective by simply conveying an emotion or delivering a singular message. A research report, however, holds significantly more information, so I tend to think about them more as a newspaper or magazine. I need to make the information visually engaging but also incredibly clear, and minimalism naturally lends itself to that. You’re not looking for an attention-grabbing quick hit, you’re looking to keep people engaged with each page. To do that, you need to remove as much distraction as possible.
You design a lot of reports and infographics, but your talent is incredibly versatile. You create and produce videos, you’ve built multiple websites, and you work with motion graphics and interactivity. Do you have a favorite?
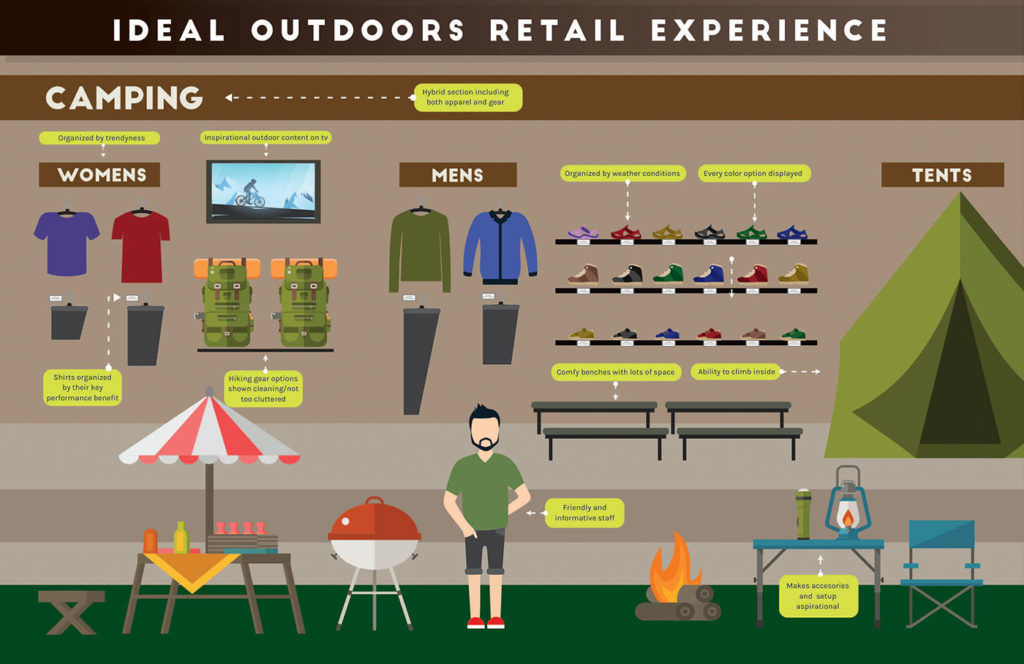
In our reports we often mix more standard slides with ones that are high-concept and require a high level of thinking and design. The high-concept slides are my favorite thing to work on. They’re like puzzles – you need to illustrate an idea, or fit a lot of information, while making it feel balanced and easy to understand. I like to switch up media formats and work in video or web for variety, but I’ll always go back to the challenge of a good high-concept design piece.
If you had to choose, which project are you most proud of?
A client of ours had a wealth of information about one of their target audiences. The problem for them was that the information was spread across dozens of different research reports. As they readied for a product launch, they wanted to create one central guide that housed all that information in one place. Creating the guide was a labor of love and has been my favorite project to date. The guide was about twenty chapters of information and very editorially driven so I created a core layout structure and branched out creatively from there.
What do you enjoy doing outside of work?
Oh, I have a million hobbies that I switch through chaotically, but one of the main ones is music. I play the piano but I’m mostly playing the guitar at the moment. I have a Beatles book that I’m slowly working through. Someone said that if you can learn all the Beatles’ songs, you’ll pretty much know all the chords that exist. So I’m trying that out. I also do illustration and I love going on walks and hanging out with friends.